The Unique Property
Site Blog
Climate Change, Some Questions
Watch on Youtube: https://youtu.be/jiwecjaz6uM
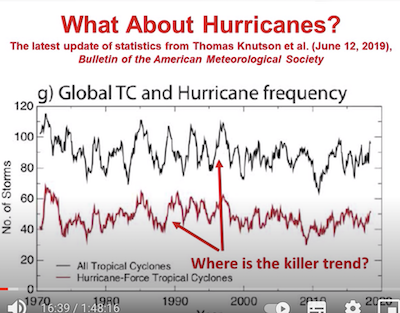
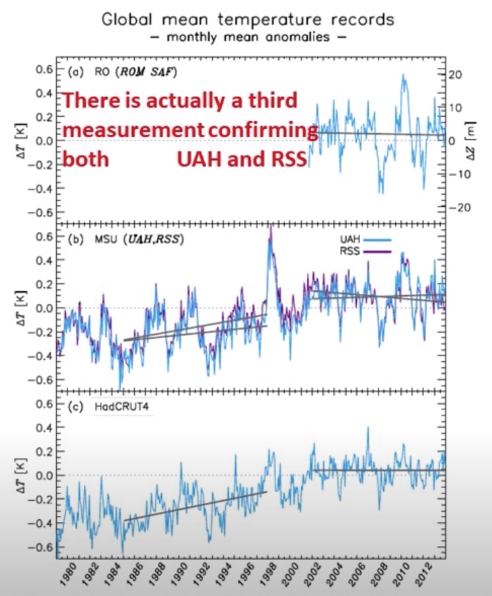
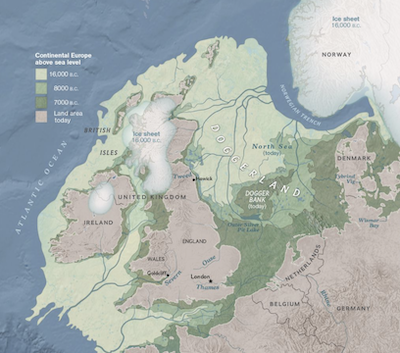
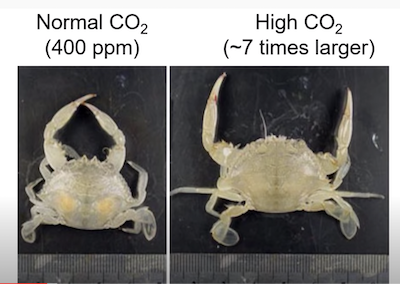
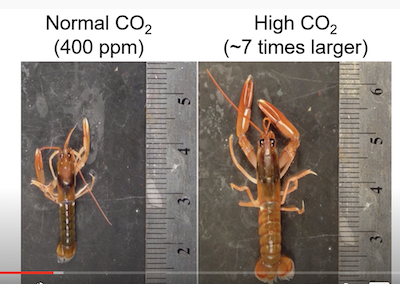
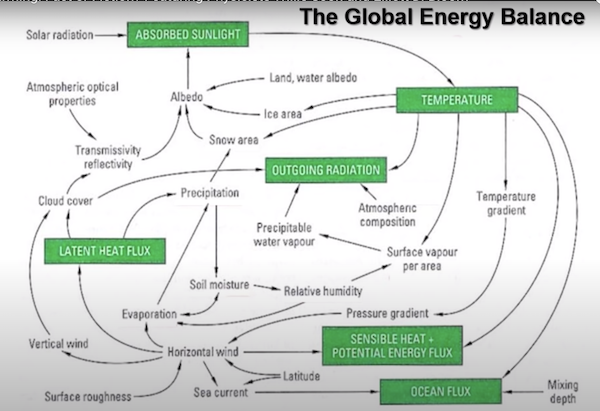
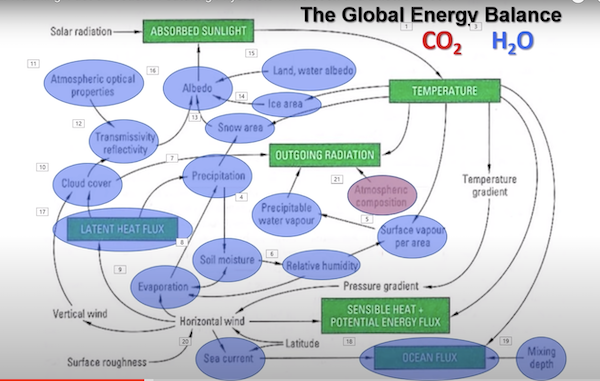
Here are the charts referred to both in my newspaper article and the Climate Change blog.
What really knocks the CO2 story on the head is the last chart, which shows how important water is in the way the atmosphere is affected.
All this leaves out the effects caused by sun spots and other solar activity, the ellipse-shape of the earth's orbit around the sun, which means the sun's energy reaching the earth varies by 30% on each rotation, and the polar tilt (the earth's wobble) which varies by 4 degrees.
Here's a chart of the temperatures of the last five or six ice ages, plus the interglacials:
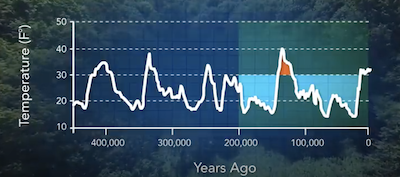
As you can see above, the current warm period is much lower than the last ones, and warm periods dont last very long.

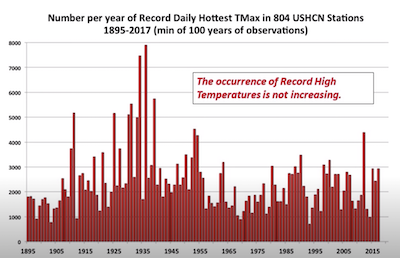
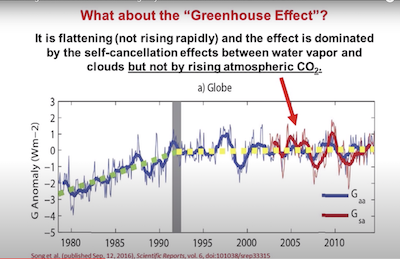
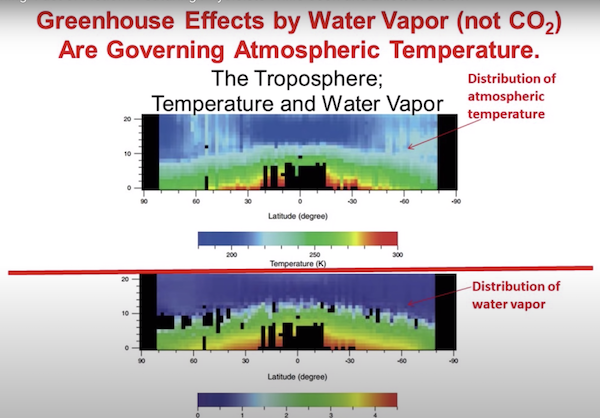
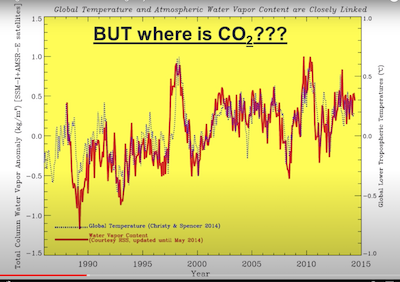 The correlation between warming and
water vapour content is identical.
|
Subscribe
to our email alerts on the housing markets both
in the UK and abroad.
|